How Healthcare Organizations Build a Foundation to Harness Healthcare Analytics
Sanford Health’s leaders have prescribed a new kind of medicine to improve patient health: advanced data analytics. The Sioux Falls, S.D.-based healthcare provider centralized its data by building a virtual data warehouse, while a team of employees worked on information governance by developing standard definitions for healthcare terms, making data from different business and clinical applications usable for analysis.
Now Sanford Health is building algorithms that enable the 44-hospital, 291-clinic health system to predict patient behavior and outcomes, such as potential appointment skipping. It’s going one step further by also deploying prescriptive analytics, which provide recommended actions, such as best practices for convincing patients to show up for appointments.
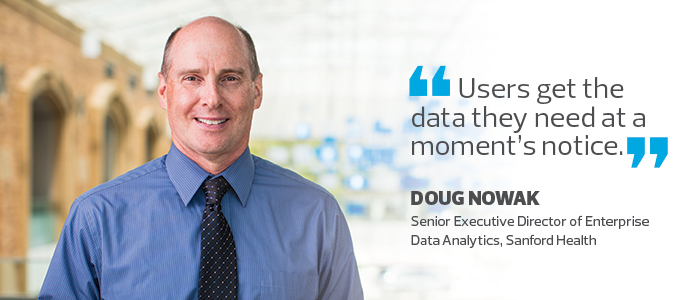
“We needed to centralize our data to have one source of truth,” says Doug Nowak, senior executive director of enterprise data analytics at Sanford Health. “Now we’re mining that data and are able to make informed decisions versus making gut decisions.”
More and more healthcare providers have started investing heavily in data analytics for research, as well as to gain insight into their business and clinical operations and improve patient care and population health efforts.
Cynthia Burghard, a research director with IDC Health Insights, says analytics adoption is still in its early stages in healthcare, but that it’s growing rapidly because it allows organizations to provide more efficient and effective patient care, which is critical as the industry transitions from fee-for-service to value-based pricing.
“The business model in healthcare used to be ‘I do something, I get paid for it,’” she says. “The business model now is ‘I better do the right thing; otherwise, I won’t get paid.’ The only way to know how to do the right thing now is with data.”
SIGN UP: Get more news from the HealthTech newsletter in your inbox every two weeks!
Sanford Health Unifies, Virtualizes Data to Speed Access
Data analytics adoption has grown the past few years as electronic health record vendors have added such capabilities to their product portfolios. Stand-alone software vendors that specialize in artificial intelligence also are offering healthcare-specific analytics applications, making it easier for providers, particularly smaller hospitals, to implement analytics, Burghard says.
Some organizations, like Sanford Health, are more do-it-yourselfers, building their own algorithms and piecing together technology, such as data warehouses and visualization tools.
About two and a half years ago, Sanford Health CEO Kelby Krabbenhoft announced an initiative to turn the health system into a data-driven organization. Nowak oversaw the transition and spent two years building the foundation.

He consolidated different data analytics teams throughout the organization into a unified, 60-person team. Then, a data governance committee created uniform definitions of healthcare terms. That’s important because Sanford Health previously had, for instance, 20 different definitions for “in-patient.”
“If someone asks for a report, we may have to get data from 15 different systems, so all the terms have to match,” Nowak says.
He used Cisco Data Virtualization (now owned by TIBCO Software) to create a virtual data warehouse that links together the health system’s different applications, such as patient data from its EHR, the general ledger and other clinical systems. Sanford Health’s analysts work closely with operations staff to learn what kind of data they need, then provide it nearly instantaneously through SAP tools.
Today, the organization’s executives and staff use SAP’s Lumira visualization tool to access a dashboard that provides 20 views of real-time financial and operations data. The data analytics team moves information from the data warehouse into a SAP HANA database. That allows for faster access because it stores data in memory and not on hard drives.
When users launch Lumira to view the dashboard, the tool grabs the information from HANA in 3 seconds, rather than the 45 to 60 seconds it would take if the data were accessed directly from the data warehouse.
“Users get the data they need at a moment’s notice,” Nowak says.
CHI Taps Data to Prioritize Quality and Safety
Catholic Health Initiatives (CHI) in Englewood, Colo., is also using analytics to become a data-driven health system. It has improved patient outcomes at its hospitals over the past three years, including reduced mortality rates and post-surgery complications.
CHI had a robust enterprise data warehouse when Jim Reichert, vice president of clinical analytics, moved to the corporate office in 2013 to lead the organization’s clinical analytics effort. But while CHI’s hospitals fed data into the warehouse, only small amounts were normalized, standardized and usable.
After establishing a data governance structure and standardizing on analytics tools, Reichert and his team began providing executives and hospital leaders monthly reports that track 23 metrics for quality of care, patient safety and patient engagement. They receive a score for each metric and their results are measured against national benchmarks from the Centers for Disease Control and Prevention’s National Healthcare Safety Network and two private firms.
“Our overall goal is to get to the 75th percentile for our quality, safety and patient experience measures against those data sources,” Reichert says.
CHI’s efforts have worked. For example, from 2014 to March of this year, heart failure mortality at its hospitals dropped 24 percent, while post-operation complications, such as hip fractures, decreased 79 percent.
Nationwide Children's Hospital Predicts the Future with Analytics
At Nationwide Children’s Hospital in Columbus, Ohio, a team of six data scientists works with the hospital’s 25-person research information systems team to improve clinical support using analytics. The heart of its effort resides on an enterprise data warehouse built with Oracle software, says Simon Lin, the hospital’s chief research information officer.
In one project, Nationwide Children’s Hospital is testing a homegrown algorithm that can predict which children are in danger of deteriorating fast and will need to go to the intensive care unit.

The hospital’s Vitals Risk Index uses an algorithm that takes five vital signs, (heart rate, respiratory rate, systolic blood pressure, body temperature and oxygen saturation) as well as the patient’s oxygen support level, and makes an assessment objectively through a computer model, says Tyler Gorham, the lead data scientist on the project.
In testing, the algorithm was able to identify 39 percent of patients who would require cardiopulmonary resuscitation two hours before the actual event occurred. It’s an improvement over the hospital’s existing assessment method, which requires medical staff to take children’s vital signs and make a subjective assessment; that method identified just 24 percent of at-risk patients two hours before an event.
“Right now, the stats show it’s effective,” Lin says. “We’re testing it, and if it works, we’ll explore how to replicate the success elsewhere.”


