Data Analytics Fuel Efficiency for Health Organizations
In 2014, the congestive heart failure patient mortality rate at Mercy, a St. Louis-based health system, was on par with the national average of 5 percent. But by 2015, that figure dropped to 2.5 percent, says Jamie Oswald, Mercy’s manager of data analytics and engineering.
The elixir wasn’t a revolutionary drug or therapy, he says. Rather, Mercy cut the figure in half by creating a digital care pathway based on clinical benchmarks, say Oswald and Dr. Todd Stewart, vice president of clinical integrated solutions.
“If we have variation from a known best practice, we want to limit that variation,” Stewart says. “When you put the systems in place to reinforce that, you give higher quality care and you do it at a lower cost.”
A perfect storm of opportunities has fueled similar success nationwide, driving organizations to cull smarter insights from data analytics to boost care, improve workflow and cut costs.
A Mature Industry Leads to a Drop in Mortality
There’s been a leap in advancement related to the healthcare industry’s maturity and constantly growing capabilities, says Laura Craft, research vice president in Gartner’s healthcare provider practice.
She sees three factors driving improvements: increased access to digital data through electronic health records (EHR), genomics and remote monitoring; new data mining and clinical variation discovery tools; and an industry imperative to move from fee-for-service to value-based care, which relies heavily on the use of data and analytics.
“We are still an industry in catch-up mode, and many organizations struggle to figure out how to insert information into the workflow that will change behavior and make the outcome better both for the patient and for the bottom line,” Craft says.
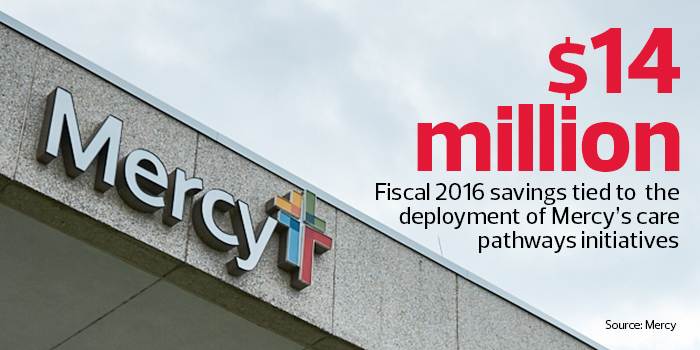
In addition to its congestive heart failure mortality rate drop — and a comparable decrease in pneumonia mortality rates — Mercy has a list of successes: Patient lengths of stay have decreased by more than 20 percent, the organization has seen reductions of $800–$1,000 in cost per case, and its stellar use of analytics earned Mercy the 2016 Healthcare Information and Management Systems Society Davies Award.
Starting Conversations with Real-Time Health Info
Mercy uses SAP BusinessObjects Business Intelligence suite, as well as SAP HANA, an in-memory data engine that allows users to model and drill down into information in real time. On Mercy’s perioperative dashboard, a manager can directly see the supply cost per case, then examine that cost for a particular procedure between one operating room and another, one doctor and another, without having to rely on IT to generate reports from a centralized data warehouse, Oswald says.
“That’s valuable because it allows a manager to identify critical variance and see that while two physicians have the same outcomes, one of them might be spending twice as much because he’s using this implant instead of this other one,” he says. “Sometimes that’s perfectly legitimate, but we want to provide just enough information so we can go and start that conversation.”
 Mercy now also embeds data from its analytics infrastructure back into its Epic EHR platform, allowing caregivers access from the same screen they use throughout their day.
Eight hundred miles to the east, the University of North Carolina Health Care System has created an enterprise analytics and data sciences group, led by Chief Analytics Officer Jason Burke, to better harness and leverage data, drive quality improvement, and manage cost of care statewide. Through the use of sophisticated analytical modeling, UNC has dramatically increased its ability to identify patients who are likely to be readmitted to hospitals.
The organization aggregates data from its Epic EHR and other systems into its Carolina Data Warehouse for Health, which runs on IBM’s Netezza platform. It also relies on SAP BusinessObjects and its added tools for predictive analytics, data visualization and statistical computing.
“It’s one thing to know that a patient is at higher risk for readmission,” Burke says. “It’s another to know that the patient is at high risk for readmission and they live in a food desert and don’t have reliable transportation. Now that becomes something a lot more actionable that care managers can engage the patient around.” [subhed] Create Usable Insights Predicting hospital readmissions isn’t the same as reducing them, however. While supplementing data in EHRs with nontraditional information about patients’ lives allows caregivers to help patients avoid making return trips to the hospital, organizations won’t see results until they figure out how to ensure that providers will act on those findings.
“The technology is probably the easiest part of our work,” Burke says. “It’s a lot harder to think about how to create usable insights. The devil really is in the details.”
Burke and his growing team have several goals for the coming year, but there’s been an early victory to celebrate: the creation of a next-generation accountable care organization framework that UNC’s care managers are using to coordinate and guide treatment for patients.
“We can only effectively do that if we’re leveraging data in more creative and intelligent ways than we have in the past,” Burke says.
At Mercy, the care pathways build on that premise. They take industry best practices, map key milestones in those processes, and present them to clinicians so that they can deliver care more quickly and easily. For instance, when treating congestive heart failure, the time it takes to deliver the first dose of diuretic that removes fluid from the heart is critical, so Mercy’s congestive heart failure pathway measures time-to-diuretic.
In instances where there’s no industry best practice metric, Mercy, which has 3,000 providers caring for millions of patients annually, uses its own data set to devise best practices.
The system monitors how often physicians take advantage of the pathways, but doctors are not required to do so.
“We have the data that shows they’re effective for care and to lower costs, but it’s still always up to the clinician,” Stewart says.
Forging A New Path for Cancer Care
Similar goals and mindset backed the 2016 launch of the Cancer Learning Intelligence Network for Quality (CancerLinQ), a cloud-based database that collects and analyzes information from oncology practices nationwide. A subsidiary of the American Society of Clinical Oncology, CancerLinQ allows practices with access to view their own health information in the system, as well as de-identified data aggregated from all of the other practices that participate.
It uses a variety of off-the-shelf and custom technologies developed in partnership with SAP, including the HANA platform, Sybase IQ database, and a data exploration and cohort creation tool. CancerLinQ also uses Tableau software for reporting.
Clinical studies provide critical insights, but they’re limited. Cancer studies take years to produce results and involve only 3 to 5 percent of adult patients with cancer. Additionally, those patients tend to be younger, healthier and less diverse than the overall population of people with cancer.
Pooling data across practices breaks down silos so doctors nationwide can collect, analyze and use real-world data in real time, says Robert Miller, vice president and medical director of CancerLinQ. Observational data sets could help improve clinical guidelines, develop new off-label uses for cancer drugs, and provide feedback for “innumerable other questions that you can’t answer with a single clinical study,” he says.
“The field is moving too fast for that to be the only source of knowledge,” Miller says.
He says former Vice President Joe Biden has already met with the CancerLinQ team a few times to discuss how its efforts in data analytics could help the Cancer Moonshot initiative, which aims to bolster the fight against cancer.
“I think it’s going to pay enormous dividends in terms of the quality of life of people with cancer,” Miller says. “Stay tuned. I think you’ll hear great things from this.”


