Hospitals and health systems increasingly want to leverage data analytics visualization tools to affect real patient and organizational change. Information pulled from a provider’s IT applications can be used for everything from improving emergency department efficiency and throughput to managing cash flow and stopping cybercriminals in their tracks.
The latter use case is especially important for Union Hospital of Cecil County in Elkton, Md., which relies on analytics to stay ahead of security threats.
“We keep our leaders well aware of what’s happening with security breaches,” says Bonnie Davis, UHCC’s director of health information services and management. “It’s all about the risk, so that’s how we presented it. The risk is definitely there and we would rather prevent it proactively than have something happen.”
UHCC uses Splunk Enterprise, in combination with security software from Carbon Black and other vendors, to drive home the message that security threats are always present and constantly evolving. For instance, analytics help the 122-bed, nonprofit community hospital flag suspicious activity patterns, such as multiple account login attempts to IT systems, including the electronic health record. The IT team can tell if multiple attempts result in an account lockout and, especially troubling, if the attempts occur outside of regular business hours or come from an external source or a foreign country where the hospital doesn’t do business.
Texas Taps Data as a Barometer of Success
At Texas Children’s Hospital in Houston, analytics help provide insights on everything from employee time tracking to patient readmissions.
The 767-bed organization, which uses Qlik’s QlikView business intelligence software, is especially focused on leveraging data analytics to help reduce maternal and fetal harm, says Frances Kelly, the former director of quality and safety at the organization’s Pavilion for Women.

Data visualization tools help Union Hospital of Cecil County track security trends, says Health Information Services and Management Director Bonnie Davis. Photo: Gary Landsman.
Texas Children’s has used the tool to build reports on the Joint Commission’s perinatal core measures, including elective delivery before 39 weeks, which is the rate of deliveries that occur before 39 weeks without a medical indication. The tool also gathers and reports data on obstetric adverse events, a composite metric that reflects eight maternal and four fetal measures.
The organization uses this as a barometer of its quality and safety progress, Kelly says.
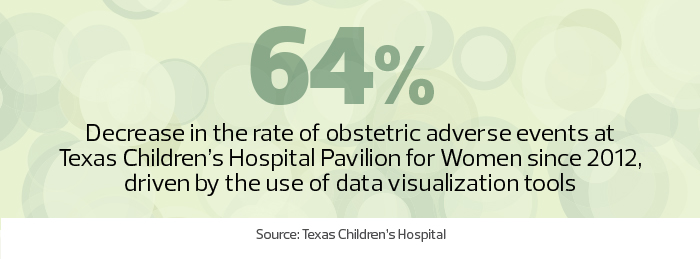
By putting the data front and center and using it to drive performance improvement projects, she says, the rate of obstetric adverse events has decreased 64 percent since the Pavilion for Women opened inpatient services in March of 2012.
UHCC also relies on analytics to manage clinical quality. Data sharing is simplified using dashboards that sort information into heat maps, charts or graphs, and with geo-visualization, available via the Google Maps add-on for Splunk Enterprise.
“It’s a really good way to ingest data that is organized and more serviceable for individuals, from security to business,” says UHCC HIPAA Security Officer Nolan Forrest. “It’s incredibly powerful.”
One report compiles readmission rates for the top five diagnoses so clinicians can better monitor at-risk patients. At daily safety huddles, the team discusses the data and how each readmission might have been prevented.
DOWNLOAD: Learn how to leverage analytics and digital health tools to drive health outcomes 24/7!
Analytics Is a Team Sport at Michigan Medicine
Ann Arbor-based Michigan Medicine, an academic medical center that’s affiliated with the University of Michigan medical school, deploys Tableau software throughout the healthcare organization to improve safety, efficiency and business processes.
Three groups at Michigan Medicine — the IT team, the business customer and the operational crew — partner on analytics projects and implement the findings, says Jonathan Greenberg, former analytics director for the organization.
“Analytics and data science are a team sport,” he says.
In one pilot program, Michigan Medicine used predictive data generated by the emergency department staff to help physicians visually track patients’ status. Tom Cook, a business intelligence analyst with the program, combined a physical map of the building with each patient’s data to create a geo-visualization of all patients. That allowed doctors to look at the map from any room on a desktop, tablet or smartphone to see not only who was sickest, but who was getting sick the fastest.
David Berrie, another business intelligence analyst at the academic medical center and health system, helped automate a complex cash reconciliation program. In six months, he’d automated almost 95 percent of the process, saving tens of thousands of dollars, Greenberg says.
“For automation, that’s insanely high,” he says.
Stakeholders and Experts Prove Key to Data Distribution
Often, analytics deployment ideas come from outside of the IT department, Greenberg says.
Photo: Gary Landsman.
“We’ve gotten really good at helping people determine their needs, analyzing the challenges of getting there, breaking it down into different pieces and then picking one of those pieces and solving it quickly and iteratively,” he says.
Looping in the right experts is critical, Kelly adds.
“You must have a data team whose members possess technical and subject matter expertise,” she says. “A team whose members are missing these requisite skills gets you nothing good or useful. It really takes a group of committed stakeholders and subject matter experts to understand what it is that you’re going to measure — and you must measure what matters. You can’t measure everything well, so choose wisely.”